Chromium Web Tools
Less than to read
This guide demonstrates the use of Chromium DevTools in the development of Sage 200 Web Screens. In particular we will focus on the elements and network tabs.
For further information please see Google’s own documentation which can be found here: Google’s Developer Tools Documentation
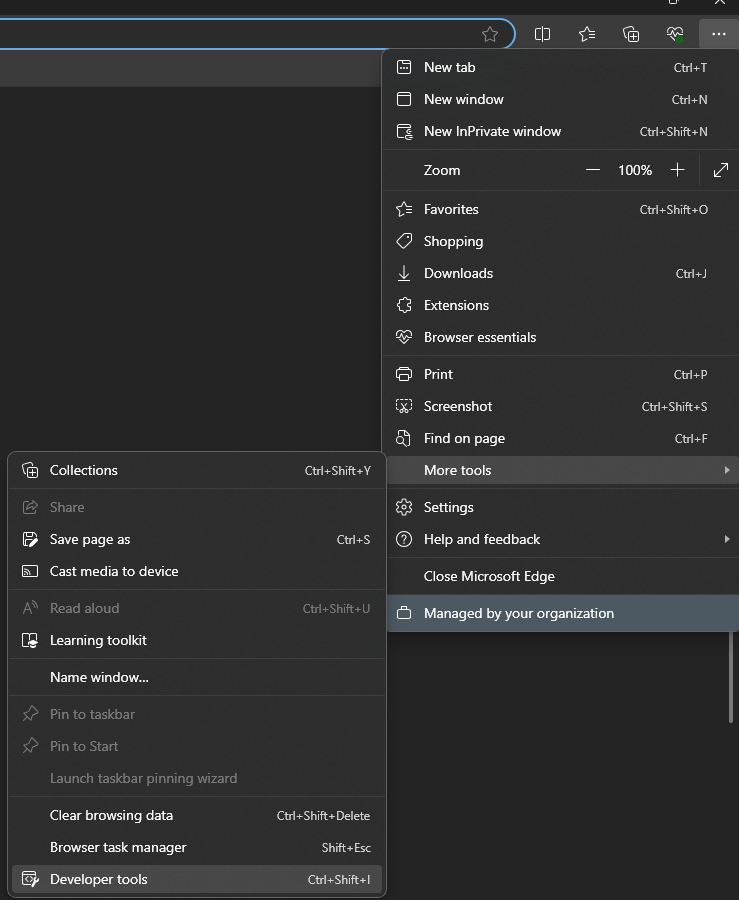
To access the web developer tools open a Chromium based browser, in our example this is google chrome, select the ⋮ button in the top right, select more tools and then developer tools. Alternatively, you can use the Ctrl + Shift + I keyboard shortcut.
Elements
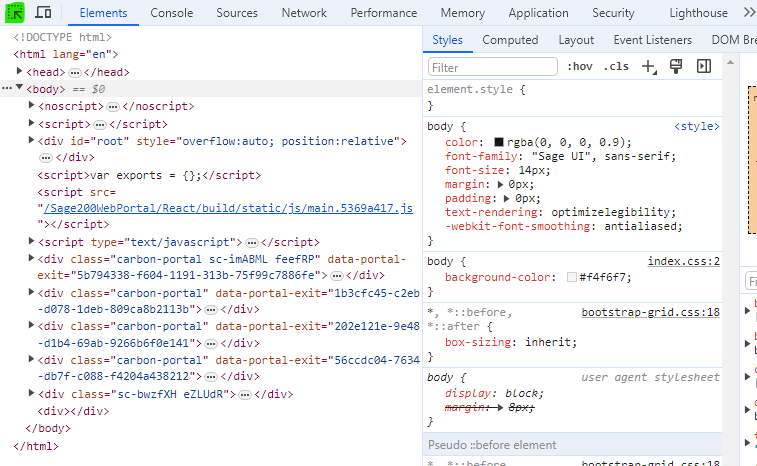
The Elements panel provides an interface for examining and manipulating the Document Object Model (DOM) of a web page. Here’s a brief overview of what you can do with it:
DOM Tree: The DOM tree in the Elements panel resembles an HTML document. You can select specific DOM nodes and modify them using other tools. Edit HTML: Use the Elements panel to view and edit the HTML structure of the page. You’ll see class names, IDs, and any comments associated with each element.
This is particularly useful when working with Sage 200 web components, the DOM tree will allow you to review the HTML for a given Sage 200 web portal screen, which will then allow you to obtain the required detail in order to add or amend web components.
Using the developer tools will allow you to navigate through the DOM tree to find the required component ID. Depending on the component you are interested in, you may navigate through many layers of the DOM tree until you find the ID for the relevant component.
One way we recommend navigating to the desired element is to open the DevTools and select the elements tab. As highlighted in the below screenshot, in the top left of the developer tools pane, you have the “Select an element in this page to inspect it” option. This will allow you to quickly navigate the DOM tree to find the required component ID. You may still require some manual navigation through the DOM tree to find what you are looking for, but this should speed up the process!
As an example, let’s say we wanted to add a new textbox to the view customers screen. We would first look at the component library to obtain the example Json. From there we would need to go back to the view customers screen where we can obtain the required detail to include in our Json. Firstly, you would need to obtain the page url which can found in the browsers URL address for the screen. In this case it would be “sales/view-customer”.
Next, we would need to use the Chomuim developer tools to obtain the pod name and the ID for the field we wish to the populate the textbox.
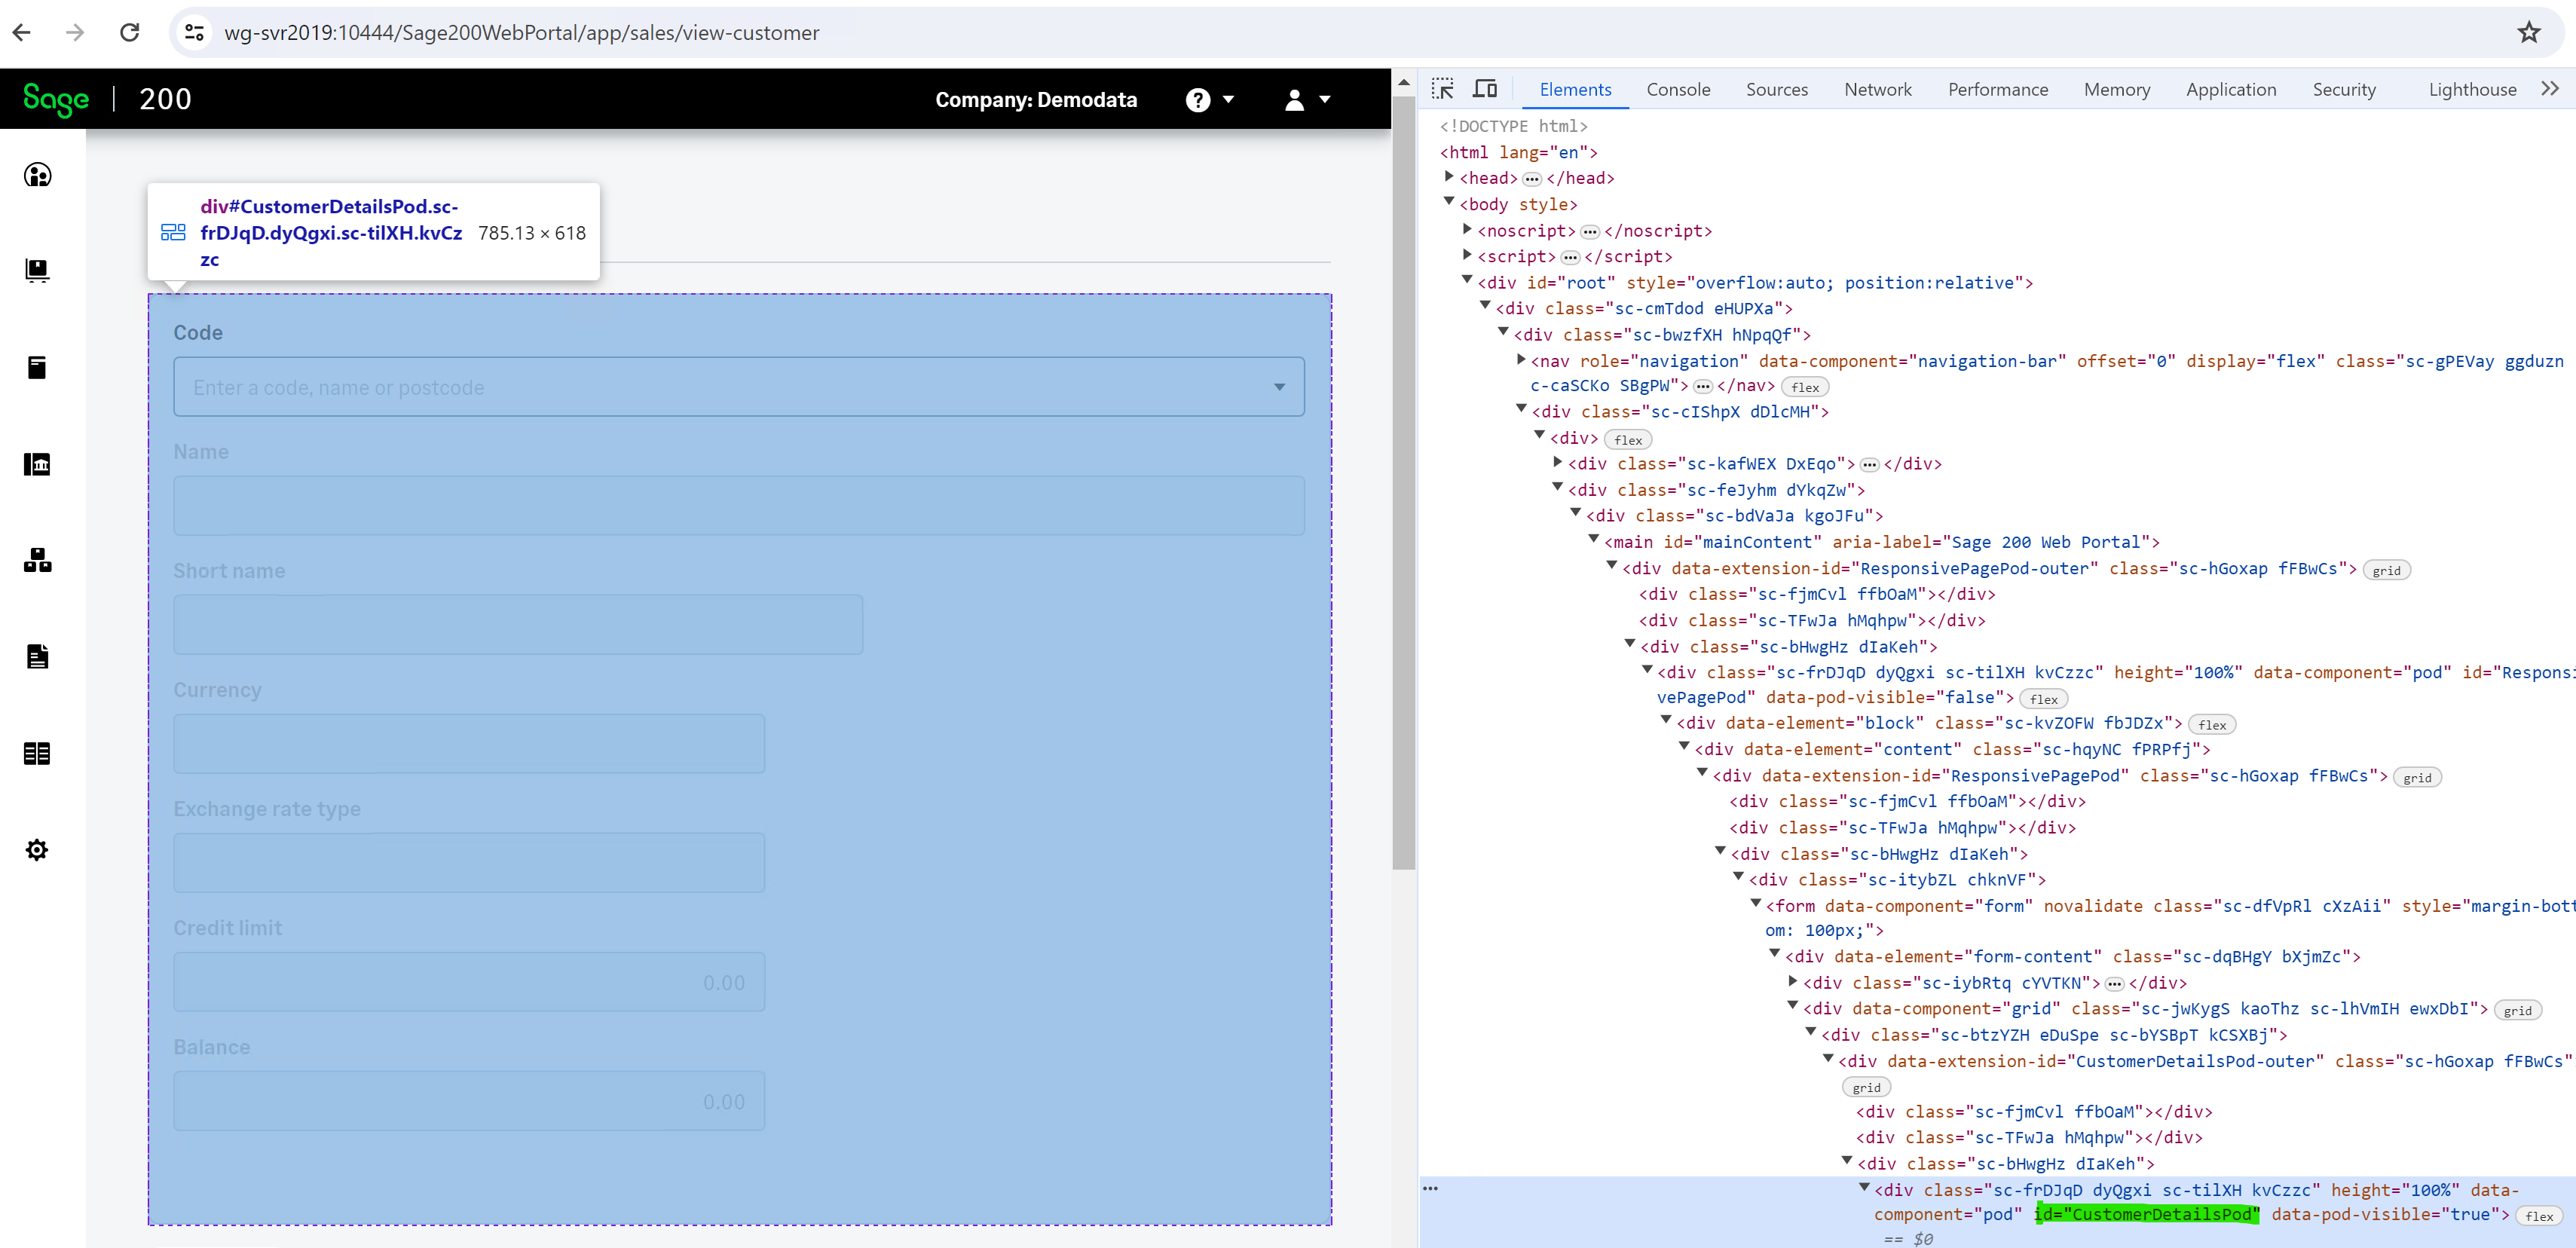
In the below screenshot we demonstrate how using the “Select an element in this page to inspect it” option to highlight the pod we wish to use and you can then see it will automatically navigate the dom tree to find this component, which we can see has an ID of “CustomerDetailsPod”.
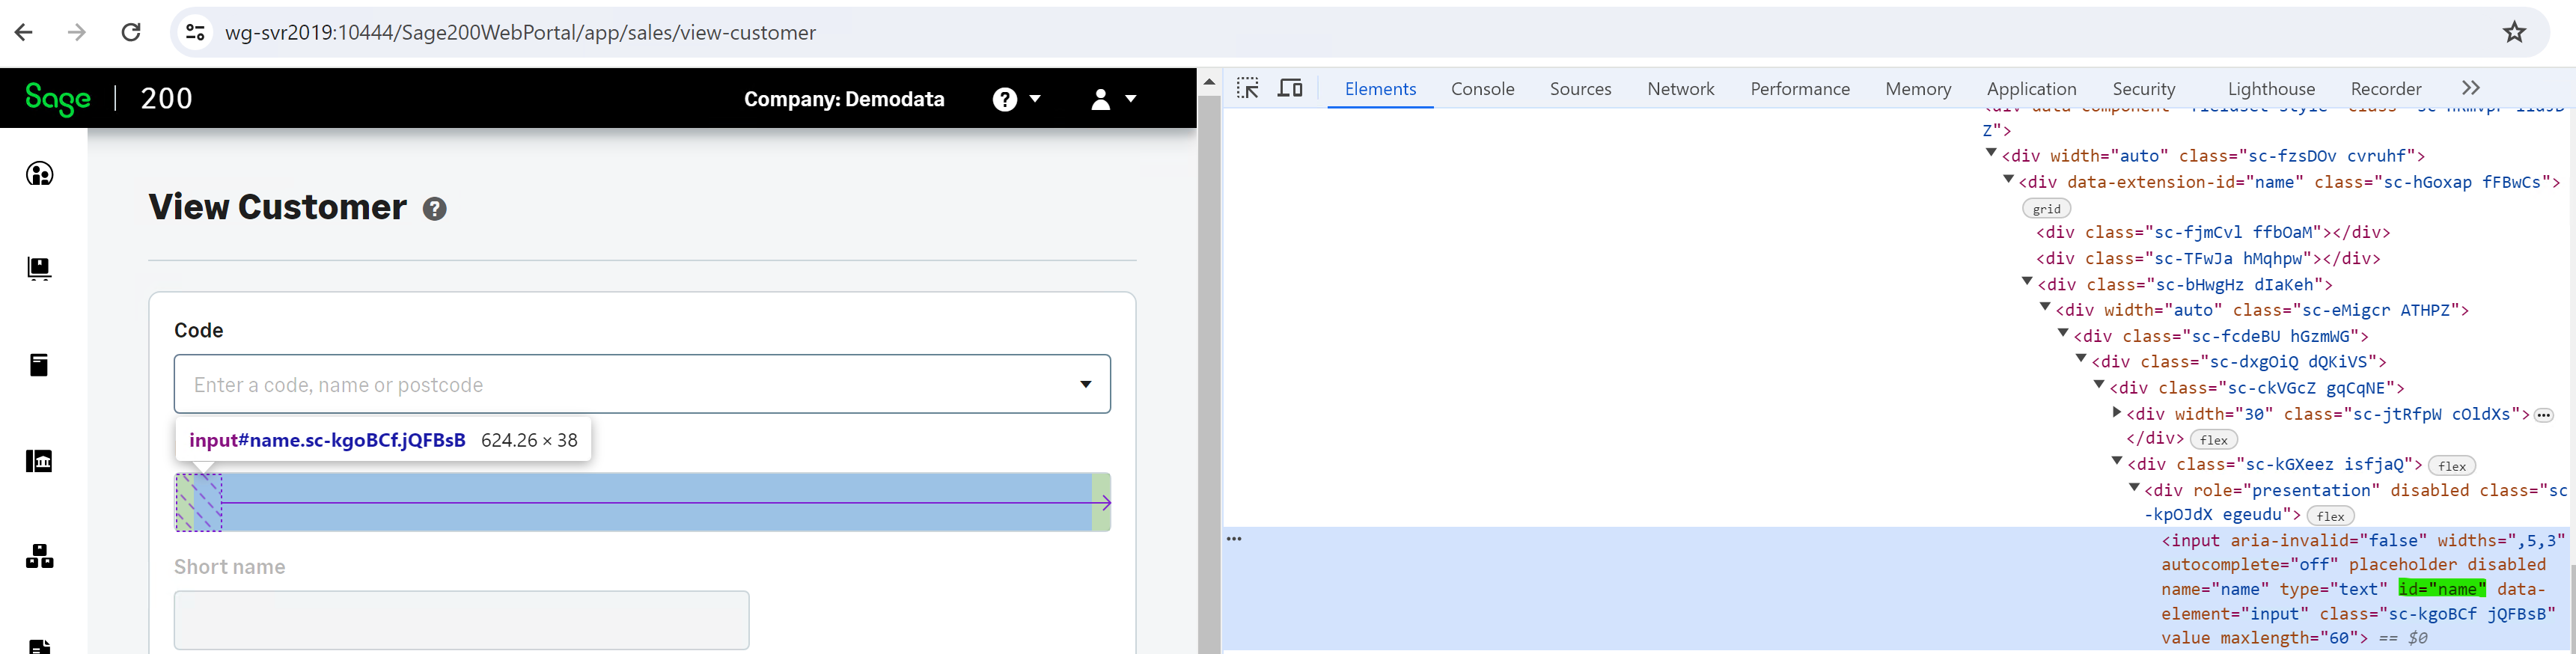
We also need to obtain the field ID to use to populate the textbox. For the purpose of this example we will use the customer name to replicate an existing textbox. To do this you would use the “Select an element in this page to inspect it” option to highlight the textbox, from there you can see the ID that is being set against the existing textbox. As shown in the screenshot below, you can see the ID that is set against the existing Name textbox is “name”.
Now we have this detail you then need to set the pages to “sales/view-customer”, the componentId to “CustomerDetailsPod” and the textbox “id” to the “name” field.
Below is an example of how you Json should now look:
{
  "version": "1.0",
  "pages": [
    "sales/view-customer"
  ],
  "uiExtensions": [
    {
      "id": "my-textbox",
      "component": [
        {
          "Textbox": {
            "id": "name",
            "label": "Customer name",
            "maxWidth": "25%"
          }
        }
      ]
    }
  ],
  "events": [
    {
      "onLoad": [
        {
          "set": {
            "pageExtension": {
              "componentId": "CustomerDetailsPod",
              "panel": "bottom",
              "uiExtension": "my-textbox"
            }
          }
        }
      ]
    }
  ]
}
Under Accounting System Manager > System Utilities > Web Extensions. You can select the add button to create a new web extension with this Json.
Network
The Network tab in Google Chrome Developer Tools allows developers to observe all network activity that occurs during the loading and use of a web page. When you open the Network tab, it starts logging all the network requests made by the page. This includes file downloads, API calls, and any other resources fetched by the page. Here is an example below.
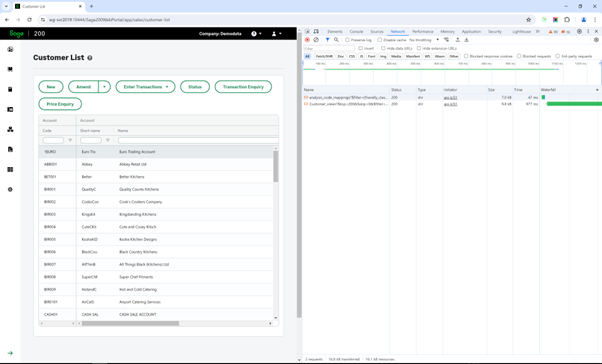
As you can see in the above image, the network tab has logged two API calls that are made to hydrate the customer list when this screen is first accessed.
If you are looking to add a new component like a textbox that will be populated by a standard or custom field. As long as this field is exposed via the API endpoint that populates the web screen then you can use this in your component.
The only caveat is that if the endpoint is a view endpoint, these endpoints will not include custom fields as they directly map fields from existing tables.
If a custom field has been created for an existing Sage 200 persistent object via Object Store Builder and deployed to a client’s site, then no additional changes are required to expose these fields to the Sage 200 API.
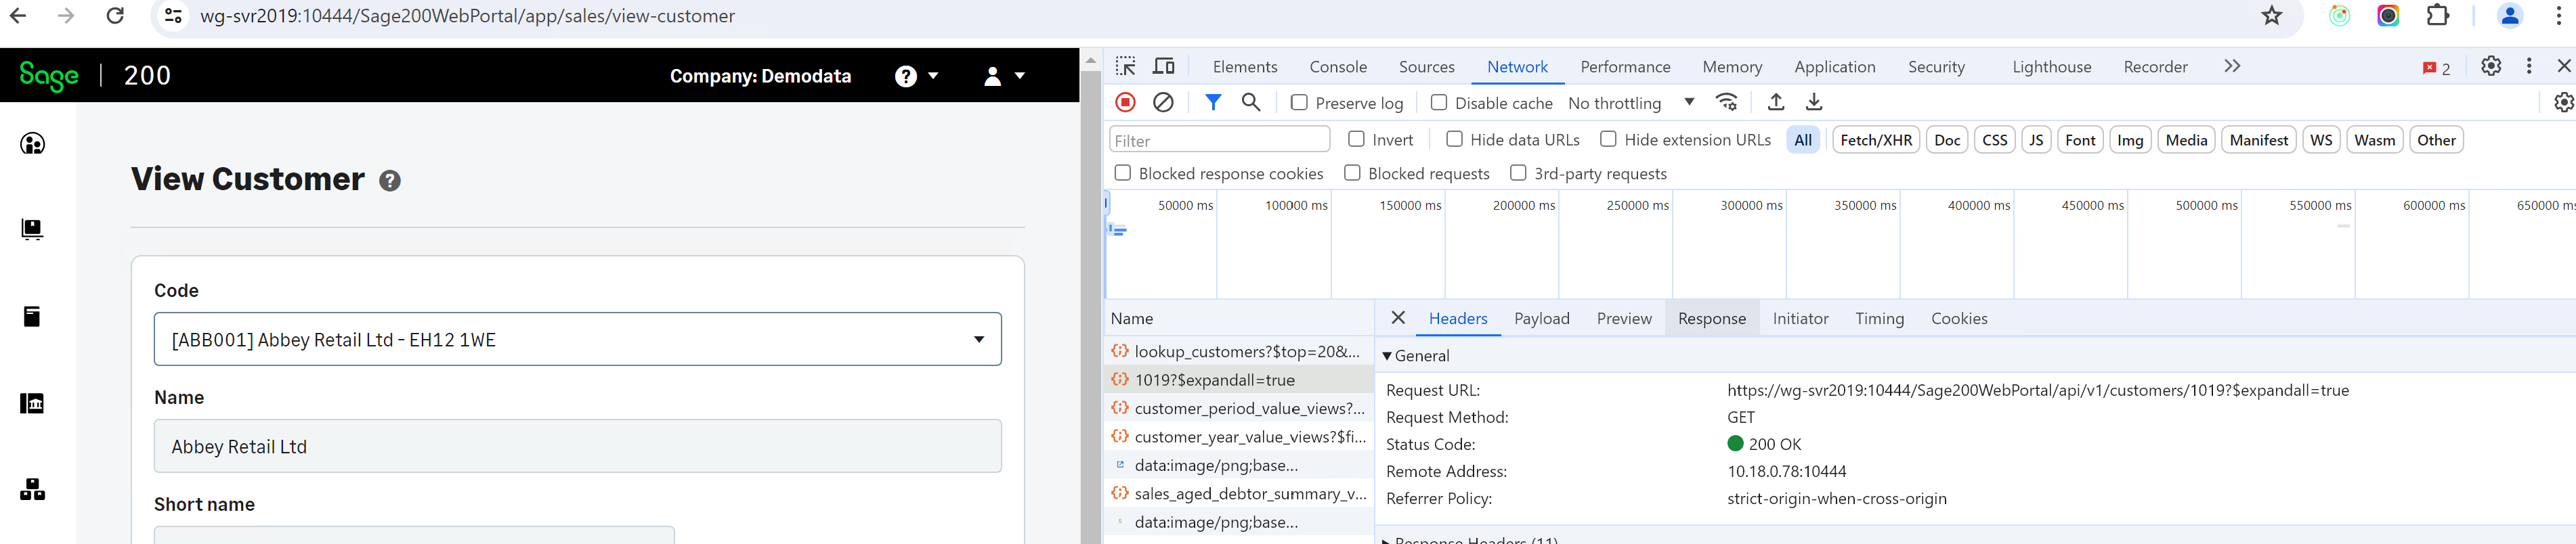
For example, if we continue with the example detailed above, we can utilise the network tab on the view customers screen to understand the API requests made to hydrate the “CustomerDetailsPod” when a customer record is selected. To do this, first access the view customers screen, before selecting a customer record make sure you have the network tab open in the developer tools. Once a customer record is selected you will see the network tab populate with all the API requests made.
You will then see a number of API requests made relating to the selected customer record as shown in the image below. The request we are interested in is the request made to the customers endpoint. If you click on that specific request you will then have the option to view the response. Any field returned in that response we can now set as the id for the new textbox.
For this example, we are going to use the “website” field and add this to our existing web extension code. This will be added as a new UIExtension within the component array. Here is an example of how the Json should look.
{
  "version": "1.0",
  "pages": [
    "sales/view-customer"
  ],
  "uiExtensions": [
    {
      "id": "my-textbox",
      "component": [
        {
          "Textbox": {
            "id": "name",
            "label": "Customer name",
            "maxWidth": "35%"

          }
        },
        {
          "Textbox": {
            "id": "website",
            "label": "Website",
            "maxWidth": "60%"

          }
        }
      ]
    }
  ],
  "events": [
    {
      "onLoad": [
        {
          "set": {
            "pageExtension": {
              "componentId": "CustomerDetailsPod",
              "panel": "bottom",
              "uiExtension": "my-textbox"
            }
          }
        }
      ]
    }
  ]
}